Communicating Big Data: How to Create Story-Driven Infographics
There is no better way to blend data, style, and content than with a well-crafted infographic.
We live in the age of Big Data and it’s important as communicators we keep that in mind when conveying information to our audiences. While Big Data provides us with new and interesting metrics and insights, it is easy to get lost in the data and lose sight of the message we are trying to convey. One of the best and most effective tools to take advantage of the privileges afforded to us by the dawn of Big Data is the infographic.

(Image courtesy of Data Science Central)
Throwing a bunch of numbers and charts together in a semi-coherent graphic, however, is not how you should go about creating an effective and compelling infographic. Instead, an infographic should be about creating a narrative and telling a story. Your audience won’t want to plod through your copy, data, and graphics (regardless of how great they may be) if there is no perceived pay-off at the end, and that’s where creativity and crafting a narrative comes in.
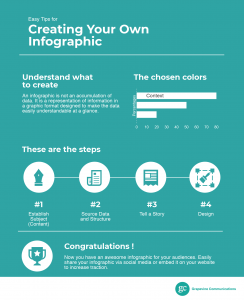
Your first priority should be establishing your topic, understanding your specific angle, and sticking to it. If you’re not sure your approach is specific enough, ask yourself, “can this be contained to just one graphic?” and if your answer is no, then it’s probably too broad and should perhaps be explored through a series of infographics.
Once you’ve got your topic and angle, the next step is sourcing your data. The most important aspect of data collection to keep in mind is to keep it relevant while also providing insight for the reader. While curating your relevant data, your top priority is making certain that it helps communicate your story effectively without being too heavily editorialized or manipulated.
Now that you’ve got your building blocks, you can begin constructing your narrative. Start by introducing your topic, then guiding your audience through your narrative with your supporting data and clear context, and neatly wrap it up with a simple call-to-action. Make sure you have a catchy and effective headline to draw them in and you’ve summarized your points in short and succinct sentences. While written copy can help guide your reader, you really want the data and design to do its share of the heavy lifting.
Here comes what could be considered the most important part of the process: design. A good rule of thumb for designing your infographic is that sometimes less is more. You want your graphic to enhance, not distract, so keep the flashiness to a minimum and don’t feel compelled to fill every white space on the page. Try to keep your data visualizations clean and organized in a manner that’s easy for the audience to navigate.
A well-crafted, story-driven infographic can be an extremely effective communication tool in the Digital Age as we witness the rise of Big Data. Infographics are one of the best mediums for blending data, design, and copy to create a compelling narrative, and being able to create effective ones that engage readers is a skill worth developing.